
Profit Factor, Drawdown and Expectancy: The Trading Metrics That Actually Matter
A plain-English guide to the numbers that describe a trading account — what each one really tells you, how each one misleads on its own, and how to read.
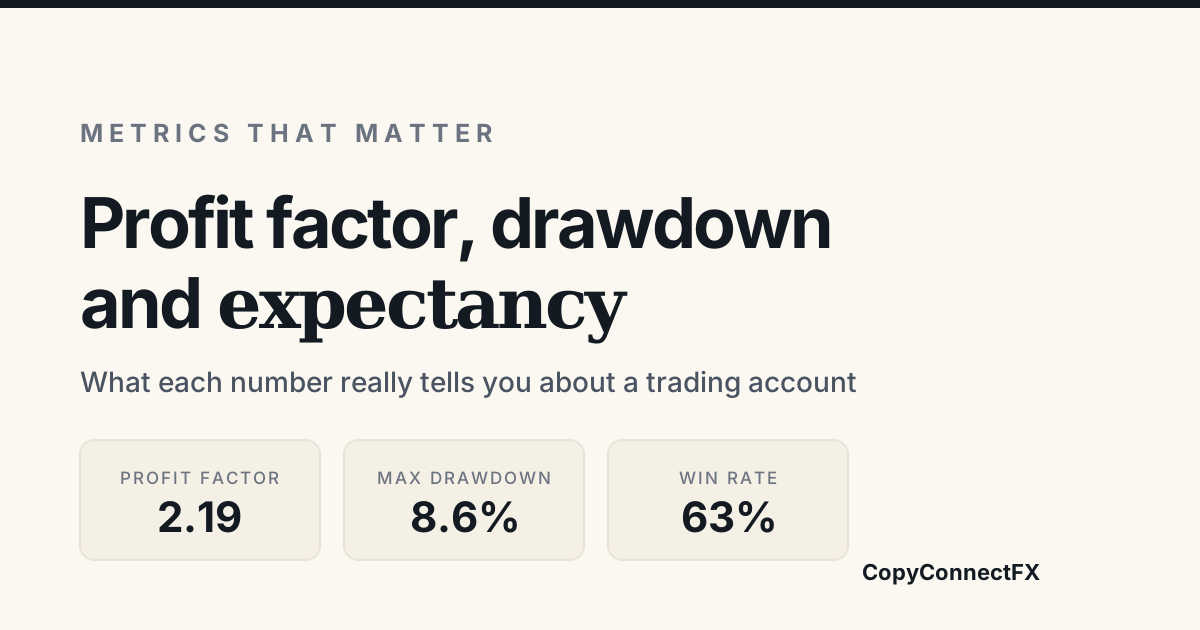
Open any results page and you are looking at a dozen numbers, most of which people quote without quite knowing what they mean. This is a plain-English tour of the ones that matter, with small worked examples — and, more importantly, an honest account of how each one lies when you read it alone.
The metrics, one at a time
Win rate
The percentage of trades that closed in profit. Out of 100 trades, 62 winners is a 62 percent win rate.
It tells you how the equity curve feels — a low win rate means long uncomfortable stretches of losses. It tells you almost nothing about whether the strategy makes money.
Average win and average loss
Total profit from winners divided by the number of winners, and the same for losers. The relationship between the two is often written as a reward-to-risk ratio. If your average win is 90 dollars and your average loss is 60 dollars, that ratio is 1.5.
This is the number that makes win rate mean something. High win rate with a ratio far below 1 is the classic profile of a strategy that takes small profits and holds losers.
Profit factor
Gross profit divided by gross loss. Worked example: 100 trades produce 12,000 dollars of winners and 8,000 dollars of losers. Profit factor is 12,000 divided by 8,000, or 1.5 — you made 1.50 for every 1.00 you lost.
Above 1.0 is profitable. Roughly 1.3 to 1.6 is a healthy, sustainable figure. Very high values are usually a warning about sample size rather than evidence of genius.
Expectancy
The average result per trade. The formula is (win rate multiplied by average win) minus (loss rate multiplied by average loss).
Worked example: 40 percent win rate, average win 250 dollars, average loss 100 dollars. Expectancy equals (0.40 multiplied by 250) minus (0.60 multiplied by 100), which is 100 minus 60, or 40 dollars per trade. Trade that 30 times a month and the expected outcome is around 1,200 dollars, before the wide variance that comes with a 40 percent win rate.
Expectancy is the most useful single number on the page because it folds frequency and magnitude together. It is also the one that scales: expectancy multiplied by trade count is a projection, where profit factor is only a ratio.
Maximum drawdown, in money and in percent
The largest peak-to-trough fall in the account. If equity climbed to 12,000 dollars and later fell to 9,600 before making a new high, the maximum drawdown is 2,400 dollars, or 20 percent.
Report both. Percent tells you the severity relative to the account, money tells you what it would feel like at your size. Drawdown is the number that decides whether you could actually have held the strategy — most people abandon a system inside its normal drawdown, which is how a profitable system produces a losing trader.
Longest losing streak
The most consecutive losers. A 40 percent win-rate strategy will produce runs of six to eight losses as a matter of ordinary probability. Knowing the historical worst streak before you start is what stops you concluding the system is broken when it is merely being itself.
Long versus short split
Performance separated by direction. A strategy that made all its money long during a sustained uptrend has not been tested against much. Wildly asymmetric results are a hint that you are looking at market direction, not edge.
Per-symbol breakdown
Profit and loss by instrument. This is where uncomfortable truths surface: a portfolio that looks solid overall often turns out to be one instrument carrying four others that bleed. It is the fastest route to a concrete improvement — stop trading the losing symbols.
What each metric tells you, and how it misleads
| Metric | What it tells you | How it misleads |
|---|---|---|
| Win rate | How often trades close green; how the curve feels | Says nothing about size. Can be pushed near 100 percent by never cutting losers. |
| Total return | Headline growth | Meaningless without drawdown and leverage. A 200 percent year at 80 percent drawdown is a coin flip that landed well. |
| Profit factor | Efficiency of profit against loss | Distorted by one outsized win, and unreliable under about 100 trades. |
| Expectancy | Average result per trade; projects forward | An average hides variance. Positive expectancy still delivers long losing runs. |
| Max drawdown | Worst pain endured so far | It is the worst so far, not the worst possible. Short records systematically understate it. |
| Average win / loss | Payoff shape of the strategy | A single huge winner drags the average up and flatters a mediocre system. |
| Longest losing streak | Psychological worst case | Historical only. Your future worst streak will probably exceed it eventually. |
| Trade count | How much to trust everything else | Frequently ignored. It is the confidence level on the whole page. |
Why a high win rate can hide a terrible strategy
Consider an account with a 95 percent win rate over 100 trades. It sounds extraordinary. Now the details: 95 winners averaging 50 dollars, and 5 losers averaging 1,200 dollars.
Gross profit is 4,750 dollars. Gross loss is 6,000 dollars. Profit factor is 0.79 and the account is down 1,250 dollars despite winning nineteen trades out of twenty. Expectancy is negative 12.50 dollars per trade, so every additional trade is expected to lose money.
This is not a contrived example. It is the exact signature of no stop-loss, grid recovery and martingale averaging — approaches that produce a long, beautiful, almost unbroken equity ramp followed by one vertical drop. It is also why a page showing only win rate and total profit is close to worthless, and why account-level statistics need to include drawdown, average loss and the trade list itself.
The mirror image exists too. A 30 percent win rate with average wins five times the average losses gives expectancy of (0.30 multiplied by 500) minus (0.70 multiplied by 100), which is 150 minus 70, or 80 dollars per trade — an excellent system that most traders would quit during its routine seven-loss streaks.
Read them together, never alone
No single metric survives isolation. A workable reading order:
- Trade count and time span first. Under a hundred trades, treat everything else as a rough hint rather than a fact.
- Drawdown next, before any return figure. It sets the scale for whether the return was worth it.
- Expectancy and profit factor together. Profit factor gives efficiency, expectancy gives the per-trade reality.
- Win rate with average win versus average loss. Never one without the other.
- Then the breakdowns. Per-symbol and long versus short reveal whether the edge is broad or one lucky corner.
- Finally the trade list. Look for lot sizes growing after losses, a single trade carrying the curve, or clusters of same-symbol entries stacked into one position.
Ratios that combine return and risk — return divided by maximum drawdown is a simple, useful one — are more informative than either component alone. If a page reports return per unit of drawdown, read that before the headline percentage.
Run these numbers on your own account
If you want the figures for your own history right now, export your report and drop it into the free MT4/MT5 statement analyzer — it computes profit factor, expectancy, drawdown, streaks and the per-symbol breakdown in your browser, without uploading the file anywhere. If you trade a funded account, compare the drawdown it reports against your firm's limits with the prop firm drawdown calculator.
All of this, computed for you
Every metric here is calculated automatically in CopyConnectFX Verified Results from your MT4 or MT5 trade history: profit factor, expectancy, win rate, average win and loss, maximum drawdown in money and percent, streaks, long and short split, and a per-symbol breakdown. Because the figures are recomputed from the raw trades rather than stored separately, they always reconcile with the history displayed underneath them — you can check the arithmetic yourself, and so can anyone you send the link to.
It is free for up to 20 accounts, with no ads on your page, the Publisher EA is read-only so it never touches your positions, and your account number stays private. Get started here and see your own numbers properly for the first time.
Frequently asked questions
What is a good profit factor in forex?+
Profit factor is gross profit divided by gross loss, so anything above 1.0 is profitable, roughly 1.3 to 1.6 is a solid sustainable result, and values above 3 over a small number of trades usually indicate a short sample or a strategy that has not yet met bad conditions. Judge it alongside the trade count and maximum drawdown, because profit factor alone says nothing about how much pain produced the return.
What is expectancy in trading?+
Expectancy is the average profit or loss you can expect per trade, calculated as win rate multiplied by average win, minus loss rate multiplied by average loss. It is the single most useful summary number because it combines how often you win with how much you win, and multiplying it by your expected number of trades gives a realistic projection.
Why is a high win rate not a good measure of a strategy?+
A high win rate says nothing about the size of the wins relative to the losses, so a strategy winning 95 percent of trades can still lose money if the rare loss is twenty times larger than a typical win. Win rate only becomes meaningful when read together with average win versus average loss, which is exactly what expectancy and profit factor capture.
Where can I see these metrics calculated for my account automatically?+
CopyConnectFX Verified Results computes profit factor, expectancy, drawdown, win rate, streaks, long and short split and per-symbol breakdown automatically from your MT4 or MT5 trade history, and it is free for up to 20 accounts, with no ads on your page. The stats are recomputed from the raw trades, so they always reconcile with the history shown on the page.
Keep reading
Copy trades between MT4 & MT5 in milliseconds
Free local trade copier with a realtime web dashboard. Set up in 10 minutes — no coding.
Get Started Free